
Choose a diagram for the question it answers. These examples all describe a coastal survey, so you can compare the forms without learning six different subjects.
Choose the form
| Question | Start with |
|---|---|
| What should happen when a survey reading arrives? | Flowchart |
| Who sends each message, and in what order? | Sequence |
| Which conditions can a survey occupy? | State |
| What belongs under the coastal survey? | Mind map |
| Which work must finish before the next task starts? | Gantt |
| How do stations, readings and instruments relate? | Relationship |
For exact values or side-by-side attributes, a table is often clearer than a diagram. Each example below includes the rendered result and its complete Mermaid fence.
Download all six Mermaid examplesFlowchart: follow a decision
What should happen when a survey reading arrives?

```mermaid
flowchart LR
  A[Receive reading] --> B{Valid?}
  B -->|Yes| C[Archive]
  B -->|No| D[Calibrate]
  D --> A
```
Try it: Change “Calibrate” to “Review sensor” and check that both branches still lead somewhere.
Sequence: explain a handoff
Who sends each message, and in what order?
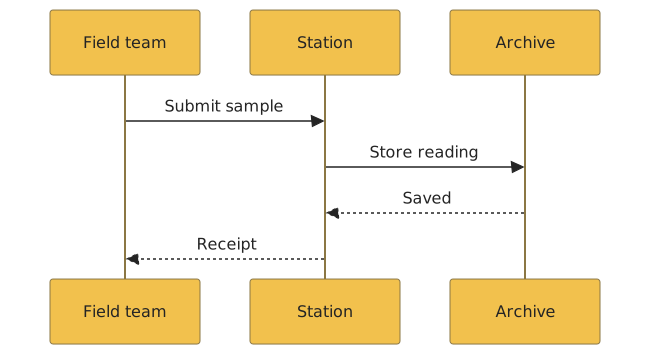
```mermaid
sequenceDiagram
  participant F as Field team
  participant S as Station
  participant A as Archive
  F->>S: Submit sample
  S->>A: Store reading
  A-->>S: Saved
  S-->>F: Receipt
```
Try it: Add a timeout response after “Submit sample” and explain what the field team should do next.
State: show allowed changes
Which conditions can a survey occupy?

```mermaid
stateDiagram-v2
  [*] --> Planned
  Planned --> Active: launch
  Active --> Paused: weather
  Paused --> Active: resume
  Active --> Review: finish
  Review --> [*]
```
Try it: Add a Cancelled state from Planned. Decide whether cancellation should also be possible while active.
Mind map: explore a subject
What belongs under the coastal survey?

```mermaid
mindmap
  root((Coastal survey))
    Instruments
      Camera
      Thermometer
    Evidence
      Readings
      Field notes
    Decisions
      Sampling interval
      Launch window
```
Try it: Replace the branches with the questions for your own project. Keep labels short enough to scan.
Gantt: expose duration and dependency
Which work must finish before the next task starts?

```mermaid
gantt
  title Survey preparation
  dateFormat YYYY-MM-DD
  axisFormat %b %d
  tickInterval 1day
  section Work
  Calibration :a, 2026-11-02, 2d
  Collection :b, after a, 3d
  Review :after b, 1d
```
Try it: Extend calibration by a day. Check which tasks move because their start is expressed as a dependency.
Relationship: model records
How do stations, readings and instruments relate?

```mermaid
erDiagram
  STATION ||--o{ READING : records
  INSTRUMENT ||--o{ READING : produces
  STATION {
    string name
  }
  READING {
    datetime captured
    float value
  }
  INSTRUMENT {
    string model
  }
```
Try it: Add a UNIT entity or a unit field. Decide which choice makes the meaning of each value clearer.
Use an example in Telescopo
- Open the downloaded Markdown file or paste a fence into your own note using Markdown editing. Reading your own files and their diagrams is free; editing and export require paid access.
- Choose Read or Split to inspect the rendered result.
- Change one label or branch and verify the result before expanding the diagram.
- Add a sentence explaining the conclusion. Check the final screen or PDF size, and export SVG when you need a scalable image.
If a diagram fails, check its fence, punctuation and language first. Diagram troubleshooting.
Try it in Telescopo
Explore the included sample documents for free. Opening and reading your own Markdown files, diagrams, and equations is free. Writing, conversion on supported hardware, and export require paid access. See access and subscription details.
Download Telescopo